A Decade of Data: Celebrating 10 Years of the ETE Dashboard
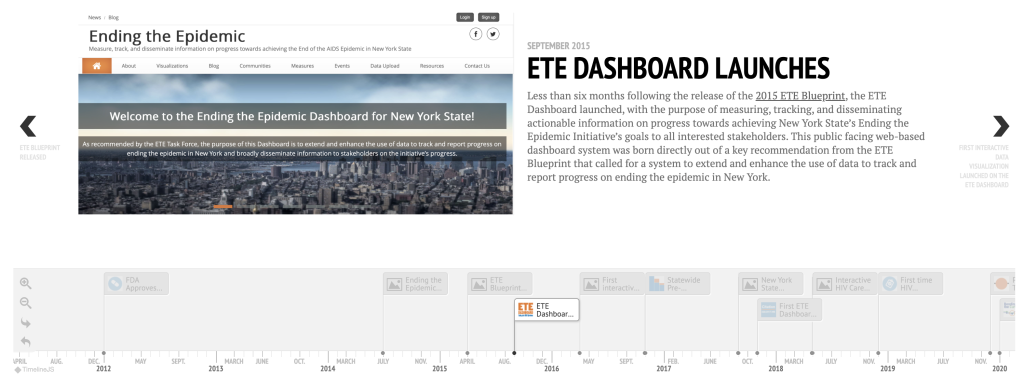
In September, 2015, we launched the Ending the Epidemic (ETE) Dashboard to provide a central resource for tracking and disseminating New York State’s progress toward ending the HIV/AIDS epidemic. Our mission to make data more accessible and usable to a broad audience of stakeholders was rooted in a key recommendation from New York State’s ETE Blueprint to end AIDS to “expand and enhance the use of data to track and report progress”.
From day one, we aimed to design and build a platform that could both monitor the key metrics of success for ending the epidemic as well as become a comprehensive source of all available HIV-related outcome data for New Yorkers. Each year our team has worked to tell a more complete story of how and what New York is doing to end AIDS by adding new sources of relevant data to the core ETE metrics: from HIV-associated hospitalizations to social determinants of health to tracking progress of the ETE policy agenda. This approach also laid the groundwork for the creation and launch of New York’s Hepatitis C (HCV) Elimination and STI Dashboards.
In the months ahead, we will be publishing additional posts that dive deeper into the data presented on the Dashboard from the ETE era, with a closer look at the successes and continued obstacles to ending the epidemic for all communities.
To mark this tenth anniversary, we are releasing the ETE Dashboard Timeline, a new interactive feature that highlights key milestones of the past decade as well as some other contextual events leading to the launch of the Ending the Epidemic Initiative in New York State.
The growth and evolution of the ETE Dashboard over the past decade has only been made possible through the sustained contributions of our colleagues and partners. In particular we would like to acknowledge the leadership and staff from the New York State Department of Health AIDS Institute, whose commitment and guidance have been integral to the development of the ETE Dashboard. We also thank the New York City Department of Mental Health and Hygiene as well as countless community-based organizations, clinical providers, and consumer advocacy groups for their expertise and feedback that has helped guide the development and evolving user experience of the ETE Dashboard.